Exclusive Condo Insights 2026 — Free Singapore Condo Data Report

Exclusive Condo Insights 2026

For Singapore condo buyers and investors who want data before they commit

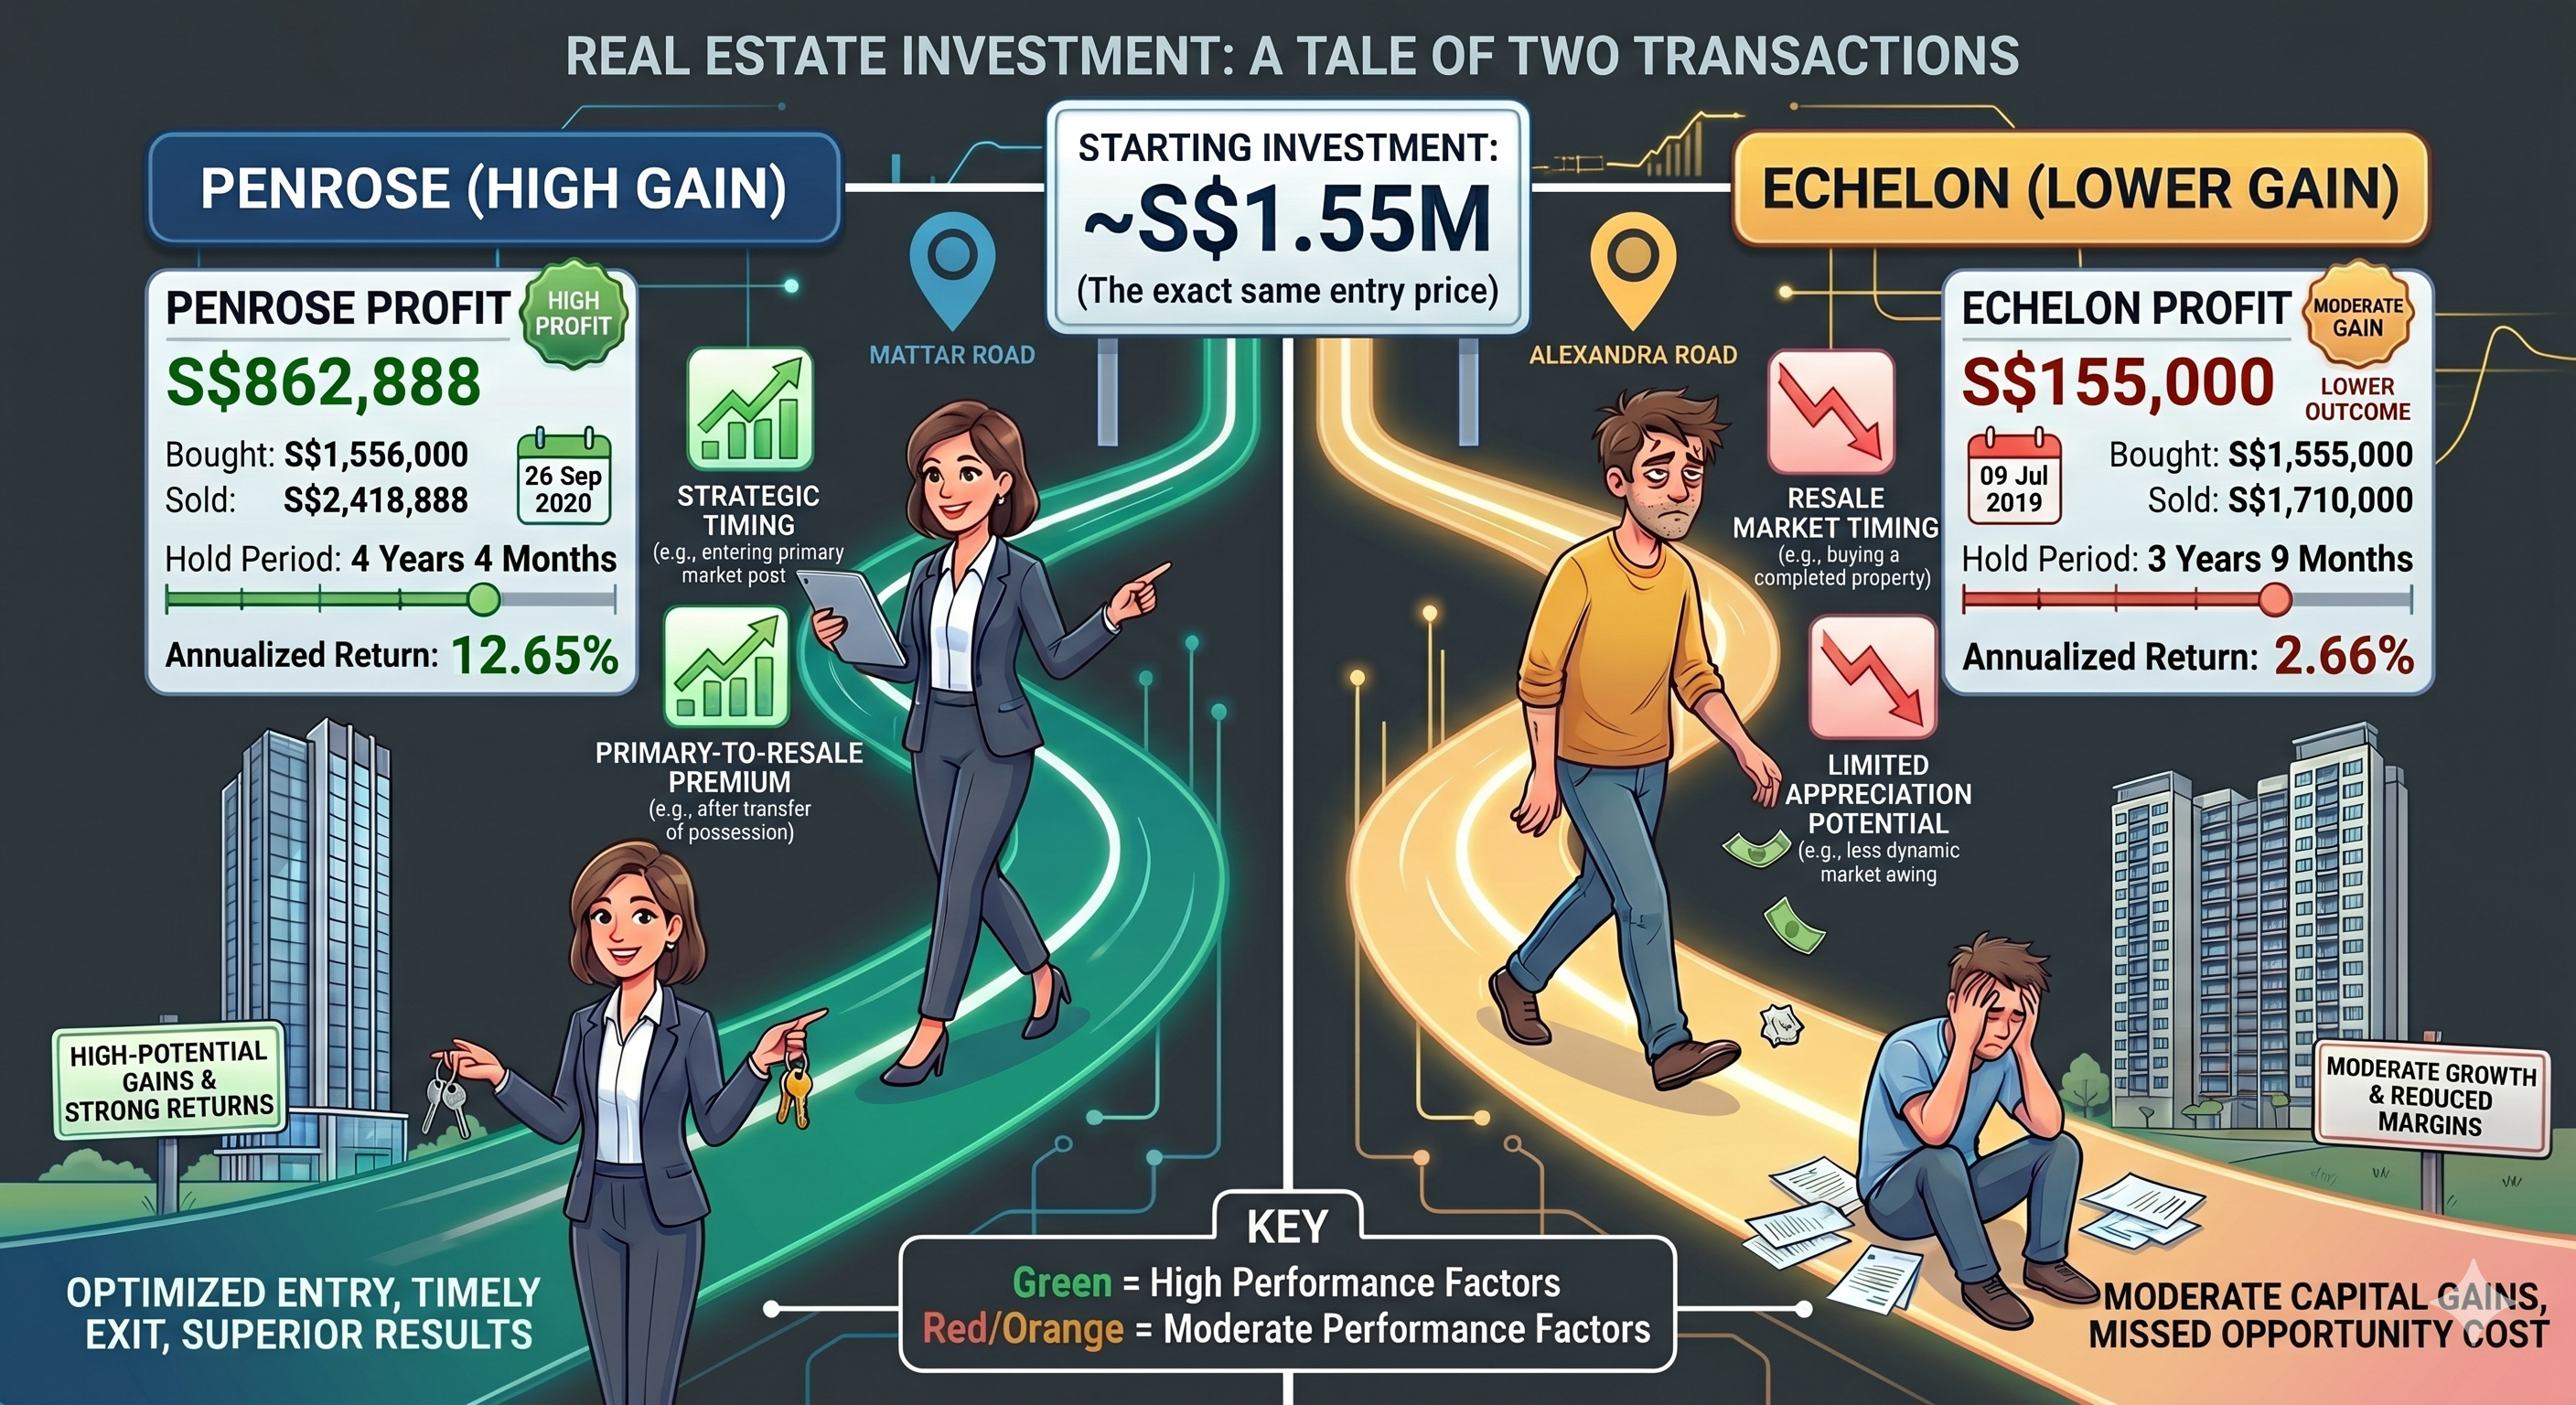
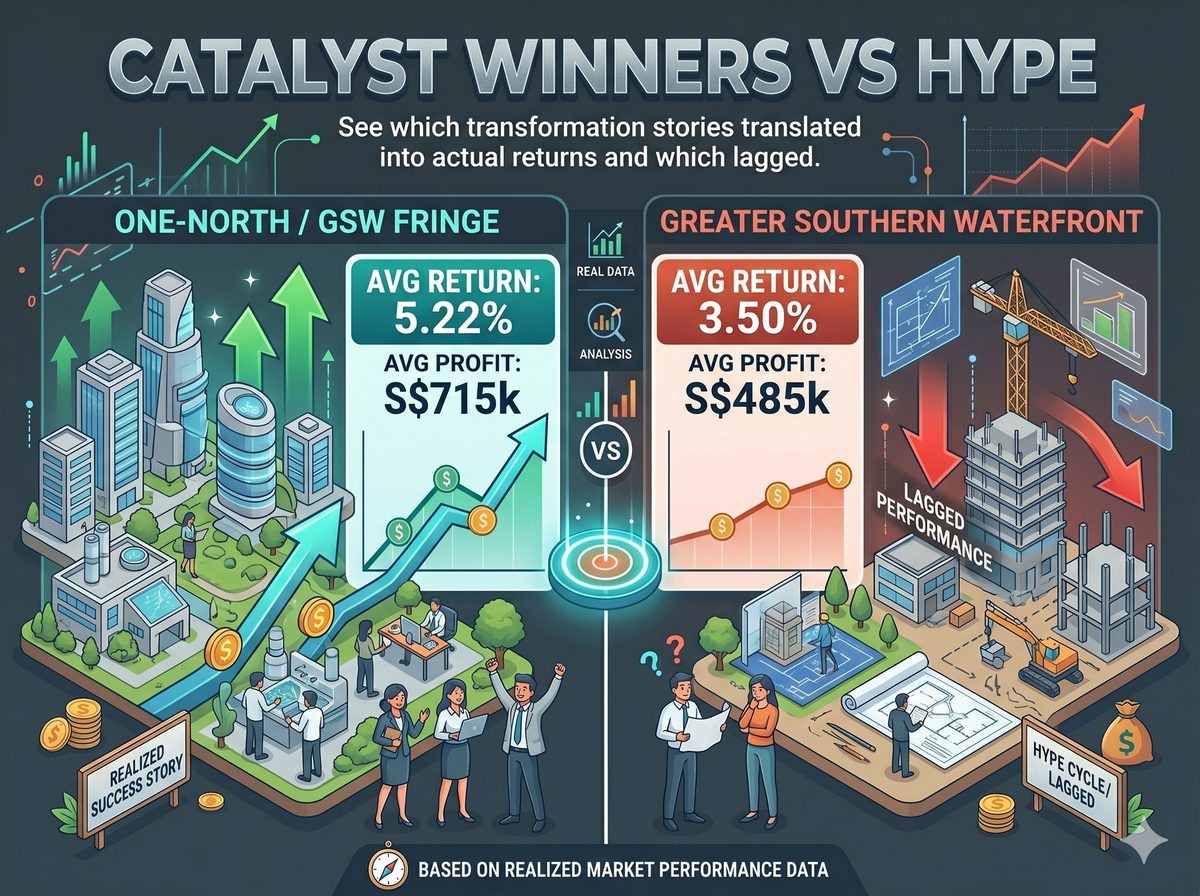
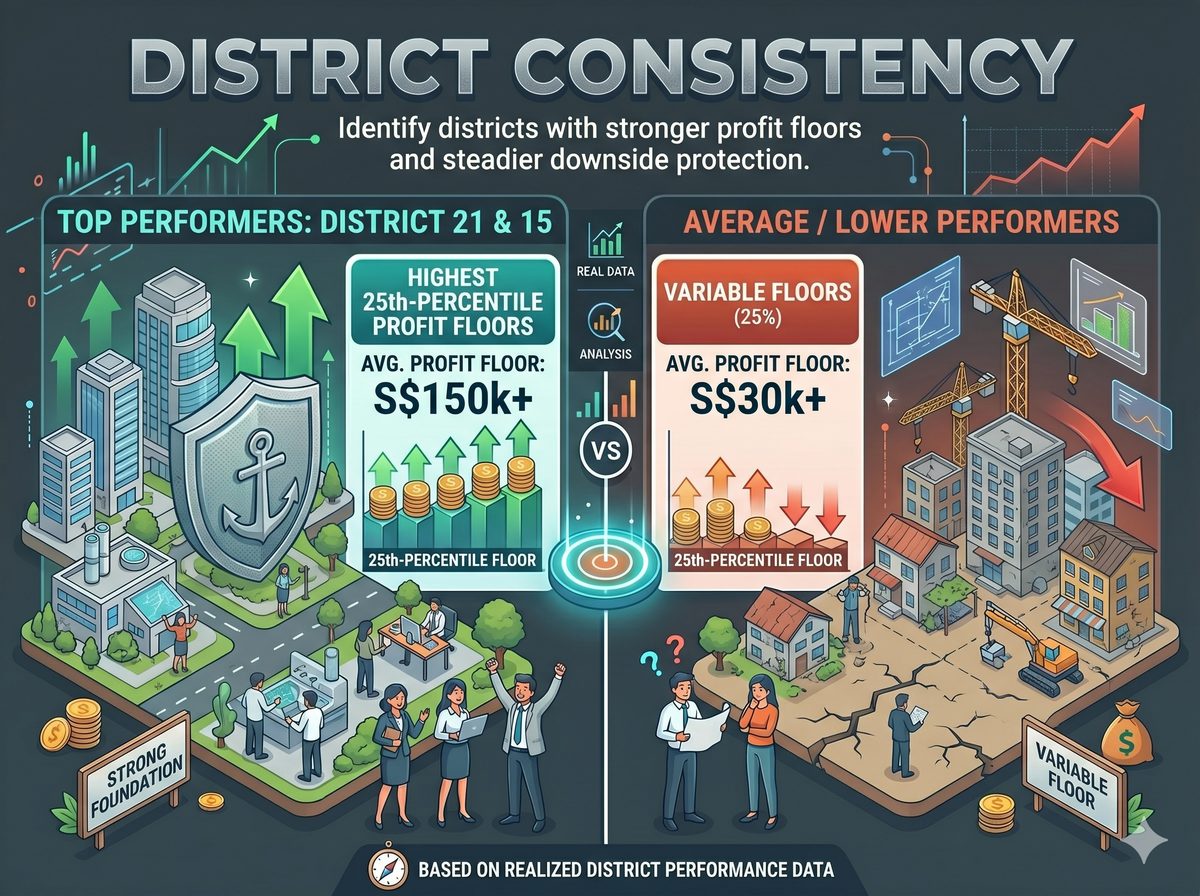
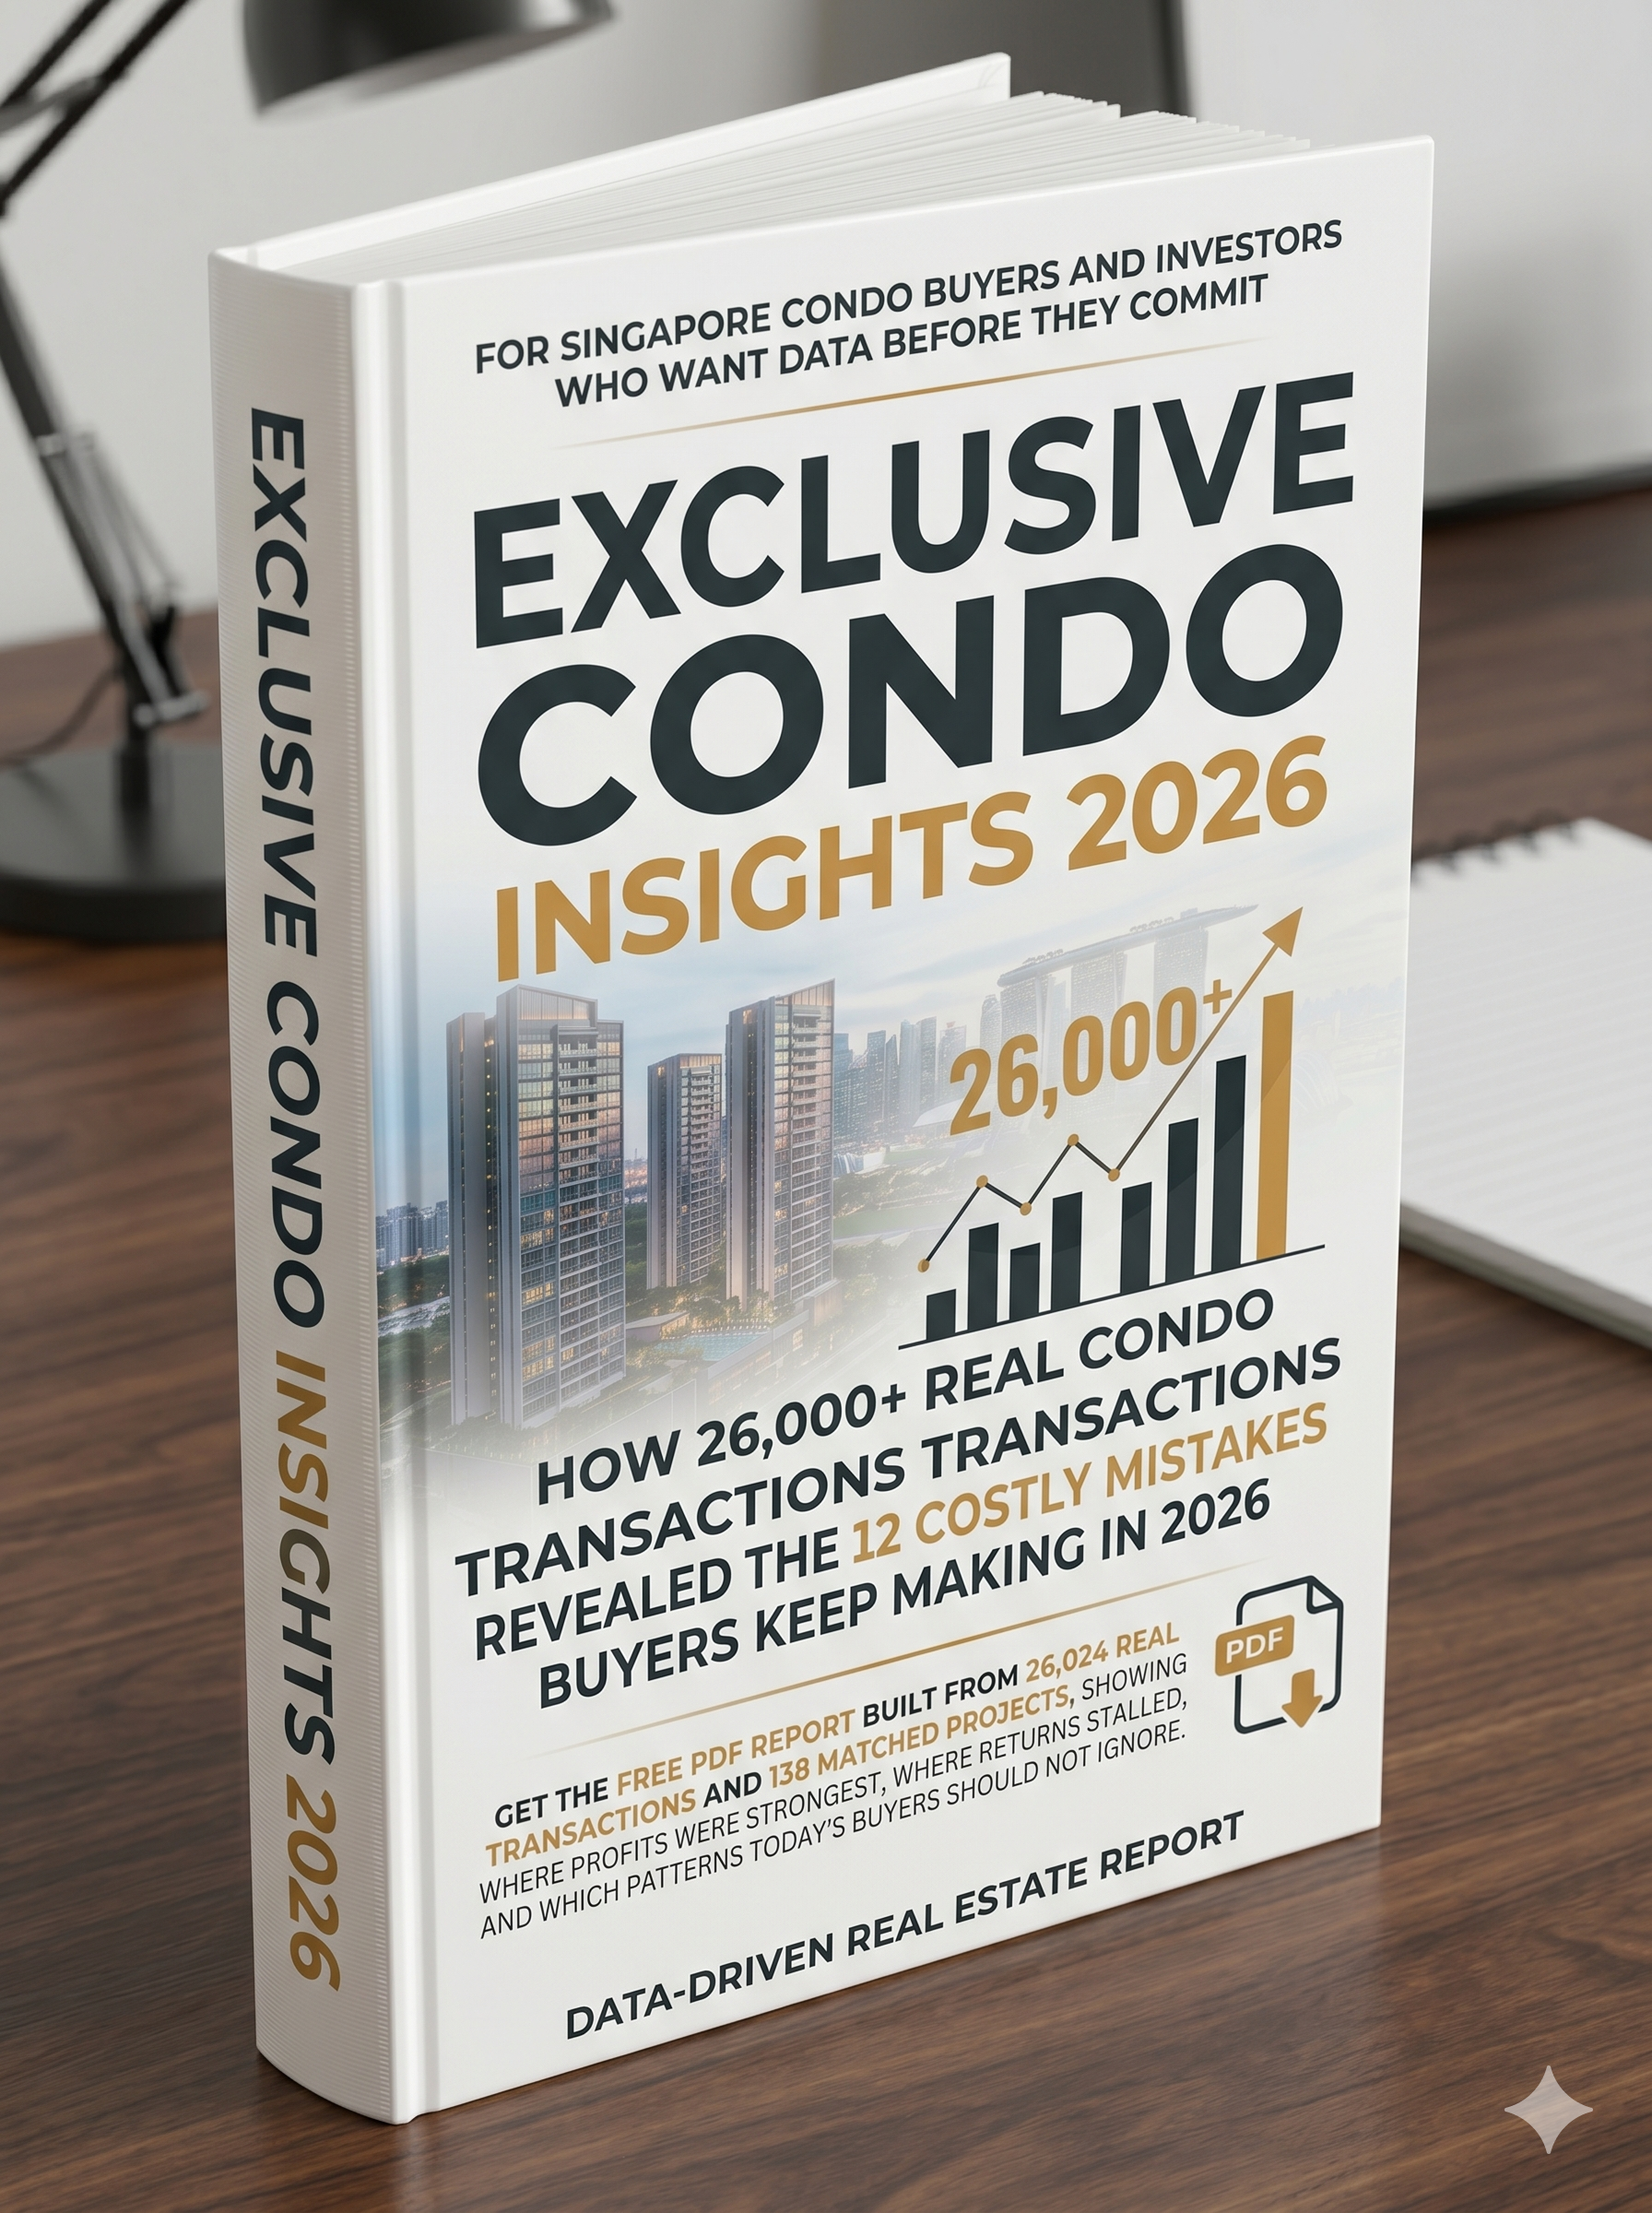
How 26,000+ Real Condo Transactions Revealed the 12 Costly Mistakes Buyers Keep Making in 2026

Get the free PDF report built from 26,024 real transactions and 140 matched projects, showing where profits were strongest, where returns stalled, and which patterns today's buyers should not ignore.

Free PDF Report · 2026

Exclusive Condo Insights 2026

12 Costly Mistakes Revealed from 26,024 Real Transactions Across 140 Singapore Condo Projects

Jamus Lee

JAMUS LEE

Property Consultant · Singapore

26,024
Transactions Analysed
140
Matched Projects
12
Costly Mistakes

Get Your Free Report

Delivered after you submit. No fluff. Just insights from 26,000+ real transactions.

Penrose vs Echelon comparison illustration

Two Buyers Can Start at Almost the Exact Same Price — And End Up with Completely Different Results.

The biggest risk in today's condo market is not just choosing the wrong district or the wrong launch story. It is assuming that a "safe-looking" project will naturally produce a strong outcome. In this tracked universe, one Penrose buyer entered at S$1.556M and exited with S$862,888 in profit, while an Echelon buyer entered at almost the exact same price point — S$1.555M — but made only S$155,000. The point is not that one project is always good and the other is always bad. The point is that buyers cannot afford to rely on surface-level heuristics when the real outcomes can diverge so sharply.

Penrose
Higher Outcome

PENROSE

Entered at S$1.556M and exited with S$862,888 profit over a medium-term hold.

S$862,888
Total Profit
Bought
S$1,556,000
26 Sep 2020
Sold
S$2,418,888
12 Feb 2025
Annualized Return 12.65%
Echelon
Lower Outcome

ECHELON

Entered at almost the same price point, but realized only S$155,000 profit.

S$155,000
Total Profit
Bought
S$1,555,000
09 Jul 2019
Sold
S$1,710,000
05 Apr 2023
Annualized Return 2.66%
Profit Gap: S$707,888

Nearly the same entry price. A radically different exit result.

That is exactly why this report matters: it helps buyers see the hidden patterns before they commit their capital.

What You Will Discover in the Report

Explore the key insights that separate strong outcomes from weak ones.

Unit Size Analysis

Size Sweet Spots

See why small units underperformed and why larger formats captured materially higher profits.

Small units
S$128.5k avg profit
3.03% return
X-Large units
S$616.7k avg profit
4.74% return
Size Sweet Spots
Location Proximity

MRT Reality Check

Understand where proximity supports returns and where distance decay starts to hurt.

Critical threshold
1.25–1.5 km band
Dropped to 2.93% annualized return
MRT Reality Check
Tenure Comparison

Tenure Truth

Compare freehold and 99-year outcomes using realized resale performance instead of assumptions.

Freehold
S$563.4k avg profit
99-year
S$331.4k avg profit
Tenure Truth
Transformation Zones

Catalyst Winners vs Hype

See which transformation stories translated into actual returns and which lagged.

One-North / GSW Fringe
5.22% return
Greater Southern Waterfront
3.50% return
Catalyst Winners
Risk Analysis

District Consistency

Identify districts with stronger profit floors and steadier downside protection.

Top performers
District 21 & 15
Highest 25th-percentile profit floors
District Consistency

Real Projects. Real Exit Outcomes. Real Lessons for Buyers.

The report does not speak in generalities. It shows what actually happened across named developments, buyer cohorts, and unit types.

Standout Performers

Penrose

PENROSE

216 transactions

Avg Return: 7.68%
Avg Profit: S$429k
The Gardens at Bishan

THE GARDENS AT BISHAN

167 transactions

Avg Return: 7.48%
Avg Profit: S$758k
Parc Clematis

PARC CLEMATIS

269 transactions

Avg Return: 6.76%
Avg Profit: S$399k
Clavon

CLAVON

167 transactions

Avg Return: 6.67%
Avg Profit: S$395k

Not Every Strong Story Wins

Urban Vista

URBAN VISTA

128 transactions

Avg Return: 1.29%
Eco

ECO

150 transactions

Avg Return: 1.50%
Reflections at Keppel Bay

REFLECTIONS AT KEPPEL BAY

143 transactions

Avg Return: 1.73%
The Hillier

THE HILLIER

135 transactions

Avg Return: 1.81%

The 12 Costly Mistakes This Report Helps Buyers Avoid

Why This Report Is Worth Reading

This is not a commentary piece built around one or two lucky case studies. The report is grounded in 26,024 transaction records, merged against a project-level dataset containing tenure, region, TOP year, MRT distance, density, and catalyst context, across 140 matched projects.

26,024

Transactions Analysed

140

Matched Projects

12

Costly Mistakes

All insights are drawn from the tracked universe. Where data is unavailable, the report states so explicitly rather than estimating.

Who This Is For

Best Fit

  • Buyers comparing resale condos and wanting a data-led shortlist
  • Existing owners evaluating an upgrade path
  • Investors who want realized exit evidence, not just launch narratives
  • Analytical buyers choosing between districts, tenure types, or unit sizes

Not the Best Fit

  • × Users looking for instant "hot tip" picks with no context
  • × Pure first-time browsers with no near-term intent
  • × Users who only want free entertainment content
  • × Users unwilling to leave contact details for the report

Frequently Asked Questions

What will I receive?

You will receive the free PDF report covering the main findings, named project examples, and the 12 costly buyer mistakes surfaced from the dataset.

How current is the report?

The analysis uses the current workbook universe available for this project, including 2026 benchmark fields in the project-level file.

Is this only for investors?

No. It is also useful for own-stay buyers who want to avoid overpaying or choosing a weaker project.

Do I get named project examples?

Yes. The report references specific developments and real exit patterns where the data supports the point.

Exclusive Condo Insights 2026

Free Report — Limited Access

Before You Shortlist Another Condo,
Read What the Data Already Says.

The smartest buyers are not the ones who see the most units. They are the ones who filter harder before they engage. This report gives that filter to you in a form you can actually use.

Get the Free Report Now

Delivered after you submit your details. No fluff. Just the most important insights from 26,000+ real transactions.